QuantShare language is a simple, complete
and fast scripting language.
It is a vector based language and contains more
than 200 build-in functions and indicators.
Example of a vector-based language: if you
type 'a = 1'.
The variable 'a' will be represented as an array of N elements
(N represent the number of bars for a specific symbol) where each element of the
array has a value of '1'.
Other examples:
c =
close;
This is the representation of the 'c'
variable.
|
10.5 |
11 |
11.2 |
11 |
10.8 |
10.5 |
10 |
10 |
10.3 |
11.2 |
The current symbol has
10 quotes (elements).
The first column represents the first bar or bar
number '0'.
If we type now: c = close + 2;
The representation of the 'c' variable will
be:
|
12.5 |
13 |
13.2 |
13 |
12.8 |
12.5 |
12 |
12 |
12.3 |
13.2 |
We added "2" to each element of
the array.
You can see these arrays at any time using the debugger tool.
(Right click on the editor).
In the next example, we will use a very
common function 'ref', this function let you refer to old or future
quotes.
c = ref (close, 1) makes the array shift by
one bar to the right.
|
NA |
10.5 |
11 |
11.2 |
11 |
10.8 |
10.5 |
10 |
10 |
10.3 |
'NA' means that the element of
the array contains no data.
A variable can be a number or a
string.
v1 = "test"; (assign the text 'test' to the
variable 'v1').
v2 = 2; (assigns the number 2 to the variable v2).
You
cannot do math calculation using both numeric and text variables.
v3 = v2 + 2; (Correct)
v3 = v2 + v1; (Not
Correct)
To concatenate two string variables or a
string and a numeric variables: use "." (Point)
v3 = "test ".v2." test";
There are two types of functions:
- Void function or function that does not return a value
Example: 'Plot' function plot a time-series on a chart.
- Functions that returns a numeric or a string array
Example: 'Rsi' (Relative strength index indicator) returns a numeric
array.
Click on 'New Chart' in the 'View' menu
to open a new chart.
Right click on the chart and click on 'Edit Formula';
the formula editor will open.
There are two ways to add a
function:
- You can add a function by typing it in the formula
editor.
- You can add a function by clicking on the 'Add void' or 'Add
function' buttons; the 'Function selector' form will
appear.
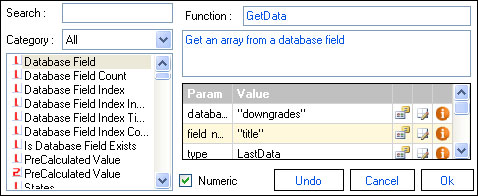
Click on 'Switch
to wizard', in the formula editor form.
There are five columns in the
wizard:
- Variable
name (Red)
- Line of
code
- Button to
add 'Void' functions
- Button to
add 'Return' functions
- Button to
remove a line
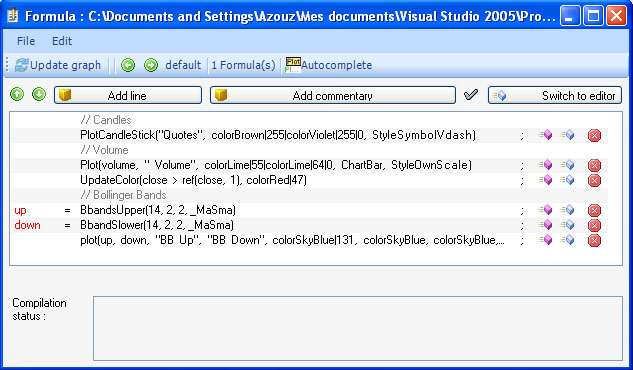
You can type '//' in the second column to
specify to the compiler that this line is a commentary line.
Switch to the
normal editor by clicking on 'Switch to editor' button.
Here is the list of the functions that let
you plot data:
- Plot: plot a vector; you can specify the color, the graph
type...
- Plot1: plot two vectors, example: higher and lower Bollinger
bands.
- PlotCandleStick: plot an OHLC
chart
- PlotFixed: plot a fixed chart, example: average performance per day
of the week or volatility for the next ten days per Relative Strength Index
values
- PlotSymbol: plot symbols above or below other graphs.
- SetMaxScale: set the Y-Axis maximum value.
- SetMinScale: set the Y-Axis minimum value.
- SetScale: set the Y-Axis maximum and minimum value.
- UpdateColor: update a graph color, on certain X-Axis
values.
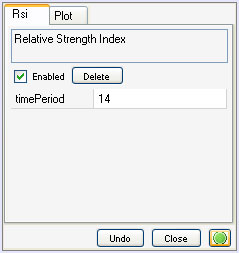
Move the mouse over a graph then right
click, a small form will appear.
Tabs shown on that form refers to functions
available in your formula.
If for example your formula is:
r = rsi
(14);
Plot(r, "RSI", colorRed, ChartLine, StyleOwnScale);
Two tabs will be available (Rsi and
Plot).
Under Rsi tab there is a cell whose name is 'timePeriod'; this cell
has a value of "14".
Click on that value, and update it using the
numeric text box or the track bar.
See how the graph updates dynamically
while you change this value.

Click on the green button to make the form
stick.
In the 'Formula Editor', press on
CTRL+SPACE, a list of 'Void' functions appears.
Now type something like 'a = ', then press
on CTRL+SPACE, another list appears; this list contains all 'Return'
functions.
There is also an 'AutoComplete' button on
the 'Formula Editor'; click on that button, then type in something in the
editor, the 'AutoComplete' list now appears each time you type in a
letter.
Tooltip shows you information about
functions.
There are two
kinds of Tooltip; one that appear right after you type in '(', example: 'Plot
('.
The other Tooltip appear when you move the mouse over a
function.

The debugger displays the elements of
the variables initialized within the formula.
In the 'Formula Editor',
right click on the editor.
When typing a formula, an icon located at
the top shows you whether your formula syntax is correct or not, clicking on
that icon shows you the formula errors if any.
The icon is red when there is
an error otherwise it is blue.
The location of the error is underlined with
a dotted line.
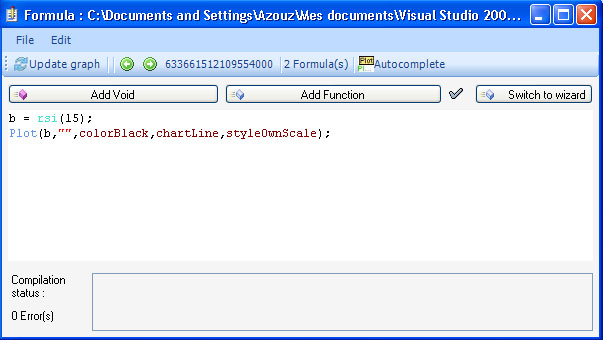
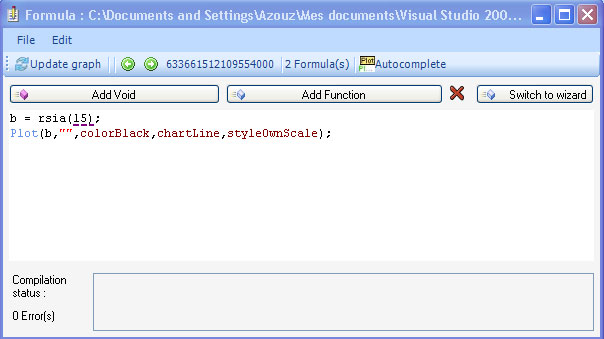
After compiling the formula by clicking on
'Update Graph', the errors if any will be listed on the 'Compilation status'
text box.